
bart cdf97#
==================================================================================================================
The bart cdf97 command performs a wavelet (CDF 9/7) transform using the BART.The Cohen-Daubechies-Feauveau 9/7 (CDF97) wavelet transform is a widely used tool in image and signal processing. The cdf97 command facilitates the application of this transform to multi-dimensional data.
Where we can view the full usage string and optional arguments with the -h flag.
!bart cdf97 -h
Usage: cdf97 [-i] bitmask <input> <output>

Perform a wavelet (cdf97) transform.

-i    inverse
-h    help
Where:
-i: Optional flag to perform the inverse wavelet transform.bitmask: Specifies the dimensions along which the transform is applied.<input>: Input file containing the data to be transformed.<output>: Output file to store the transformed data.
Examples (Using Python)#
Example 1: Apply the CDF 9/7 wavelet transform#
# Importing the required libraries
import numpy as np
import matplotlib.pyplot as plt
%matplotlib inline

import cfl
from bart import bart
phantom_image = bart(1, 'phantom -x 128') # Generate a phantom image with size 128x128
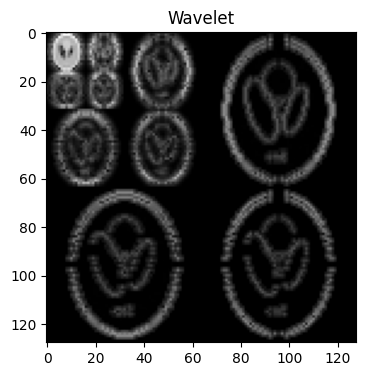
Applies the CDF 9/7 wavelet transform to the given phantom_image, specifically along the first two dimensions (based on the bitmask 3).#
wavelet = bart(1, 'cdf97 3', phantom_image)
# Visualizing the image using Matplotlib
plt.figure(figsize=(4,6))
plt.imshow(abs(wavelet)**.3, cmap='gray')
plt.title('Wavelet')
Text(0.5, 1.0, 'Wavelet')
Example 2: Apply the CDF 9/7 inverse wavelet transform#
# Performs the inverse CDF 9/7 wavelet transform on the given wavelet data, reconstructing the original data
phantom = bart(1, 'cdf97 3 -i', wavelet)
Usage: cdf97 [-i] bitmask <input> <output>
ERROR: cmdline: too few or too many arguments

Command exited with error code -6.
# Visualizing the image using Matplotlib
plt.figure(figsize=(4,6))
plt.imshow(abs(phantom), cmap='gray')
plt.title('Phantom')
---------------------------------------------------------------------------
TypeError                                 Traceback (most recent call last)
Cell In[7], line 3
      1 # Visualizing the image using Matplotlib
      2 plt.figure(figsize=(4,6))
----> 3 plt.imshow(abs(phantom), cmap='gray')
      4 plt.title('Phantom')

TypeError: bad operand type for abs(): 'NoneType'
<Figure size 400x600 with 0 Axes>